
Key Observations
- Many markets entered a technical correction (defined as a 10 percent pull back or more) in January as headline inflation reached levels not seen since the 1980s1 and the Federal Reserve continued to shift its stance, becoming less accommodative.
- It is worth noting the level and pace of the pullback year to date is typical. The median intra year draw down in the S&P 500 since 1980 is 9.3 percent.2
- We expect the pace of inflation to ease, the Fed to increase interest rates, and increased volatility in 2022 as compared to 2021.
Volatility
2022 started with a thud and plenty of market moving headlines. Omicron, inflation and the Federal Reserve, among other topics, weighed on the minds of investors. Most major indexes sold off with some crossing into a technical correction. Such a pullback is not uncommon in equity markets. Since 1980, the median intra year draw down in the S&P 500 is 9.3 percent, yet the median annual return is 13.6 percent.2 Additionally, fixed income markets pulled back over the period as investors weighed new information from the Fed.
Source: FactSet as of January 31, 2022


Source: Ben Carlson – How Often Should You Expect a Stock Market Correction?
Inflation
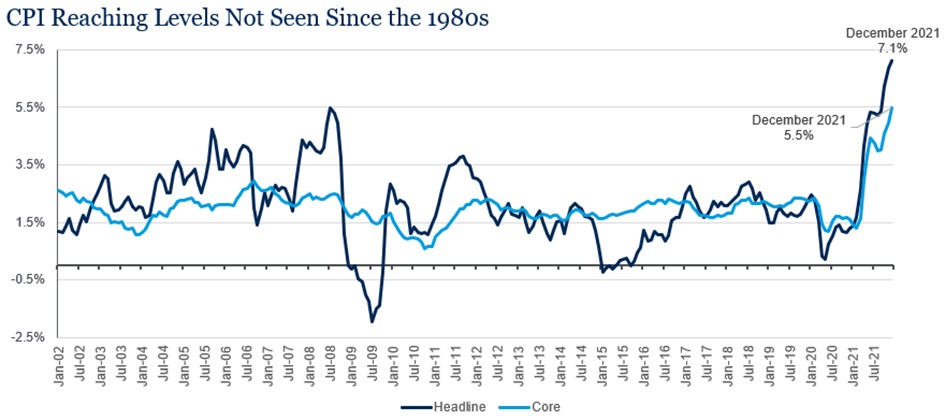
Inflation is on the minds of many investors, which came to the forefront as the Consumer Price Index (CPI) rose 7.1 percent over 2021, the strongest growth since the 1980s.1 The index was materially influenced by energy prices. Energy as a whole rose by nearly 30 percent and motor fuel was a primary contributor, up nearly 50 percent during the same time.3 In periods of rising inflation, capital intensive businesses with real (not accounting) assets on the balance sheet tend to perform better than businesses with intangible assets. The January pullback in intangible and technology-oriented companies fits this historical pattern as investors look to reconcile both higher valuations and rising inflation.
While CPI figures in January were eyebrow-raising and may persist longer than some would prefer, we believe they are unsustainable. A combination of cooling in the red-hot energy market, easing shortages of semiconductors and used car prices and unkinking of the global supply chain can help moderate headline figures. Early signs of easing can be seen below in the ISM manufacturing data and the Baltic Dry Shipping Index, which moderated from highs in 2021. With that said, we do not anticipate inflation dropping to the one to two percent range we have seen over the past two decades. We fully anticipate a more robust inflation environment in the coming years at three percent plus and believe portfolios should be positioned accordingly.


Interest Rates
As a result of higher inflation, the Fed has been under pressure to stabilize prices. On January 26, the Federal Open Markets Committee (FOMC) announced they will hold interest rates at their current level (0 – 0.25 percent) but signaled it would “soon” look to increase rates to combat higher prices. Many Fed watchers interpret “soon” as March 2022. The Fed will continue to reduce its bond buying program and indicated it will seek to shrink its balance sheet (quantitative tightening, the opposite of quantitative easing better known as QE) only after it has begun to increase the Fed Funds rate. Fed Chair Jerome Powell noted “…I think there’s quite a bit of room to raise interest rates without threatening the labor market.”4
Actionable Items
- We are adjusting most of the core portfolios to reduce core bonds and allocate to liquid alternatives.
- In retirement accounts we will further reduce core bonds in favor of dynamic bonds.
- After a great run, we are reducing real estate and making an additional allocation to broad commodities, holding the overall real assets allocation consistent.
- Consumer Price Index is a measure of prices paid by consumers for a market basket of consumer goods and services. The yearly (or monthly) growth rates represent the inflation rate.
- Bloomberg U.S. Aggregate Index covers the U.S. investment grade fixed rate bond market, with index components for government and corporate securities, mortgage pass-through securities, and asset-backed securities.
- The S&P 500 is a capitalization-weighted index designed to measure performance of the broad domestic economy through changes in the aggregate market value of 500 stocks representing all major industries.
- The NASDAQ is a broad-based capitalization-weighted index of stocks in all three NASDAQ tiers: Global Select, Global Market and Capital Market.
- Russell 1000 Growth measures the performance of those Russell 1000 companies with higher P/B ratios and higher forecasted growth values.
- Russell 1000 Value measures the performance of those Russell 1000 companies with lower P/B ratios and lower forecasted growth values.
- Russell 2000 consists of the 2,000 smallest U.S. companies in the Russell 3000 index.
- Russell 2000 Growth measures the performance of the Russell 2000 companies with higher P/B ratios and higher forecasted growth values.
- Russell 2000 Value measures the performance of those Russell 2000 companies with lower P/B ratios and lower forecasted growth values.
- MSCI EAFE is an equity index which captures large and mid-cap representation across Developed Markets countries around the world, excluding the U.S. and Canada. The index covers approximately 85% of the free float-adjusted market capitalization in each country.
- MSCI EAFE Value captures large and mid-cap securities exhibiting overall value style characteristics across Developed Markets countries around the world, excluding the U.S. and Canada. The value investment style characteristics for index construction are defined using three variables: book value to price, 12-month forward earnings to price and dividend yield. The index targets 50% coverage of the free float-adjusted market capitalization of the MSCI EAFE Index.
- MSCI EAFE Growth captures large and mid-cap securities exhibiting overall growth style characteristics across Developed Markets countries around the world, excluding the U.S. and Canada. The growth investment style characteristics for index construction are defined using five variables: long-term forward EPS growth rate, short-term forward EPS growth rate, current internal growth rate and long-term historical EPS growth trend and long-term historical sales per share growth trend. The index targets 50% coverage of the free float-adjusted market capitalization of the MSCI EAFE Index.
- MSCI Emerging Markets captures large and mid-cap representation across Emerging Markets countries. The index covers approximately 85% of the free-float adjusted market capitalization in each country.
- MSCI Emerging Markets Value captures large and mid-cap representation across Emerging Markets countries. The index covers approximately 85% of the free-float adjusted market capitalization in each country. The value investment style characteristics for index construction are defined using three variables: book value to price, 12-month forward earnings to price and dividend yield. The index targets 50% coverage of the free float-adjusted market capitalization of the MSCI Emerging Markets Index.
- MSCI Emerging Markets Growth captures large and mid-cap representation across Emerging Markets countries. The index covers approximately 85% of the free-float adjusted market capitalization in each country. The growth investment style characteristics for index construction are defined using five variables: long-term forward EPS growth rate, short-term forward EPS growth rate, current internal growth rate and long-term historical EPS growth trend and long-term historical sales per share growth trend. The index targets 50% coverage of the free float-adjusted market capitalization of the MSCI Emerging Markets Index.
- Institute for Supply Management (ISM) Manufacturing Purchasing Managers’ Index (PMI) is a monthly measure of US economic activity based on surveys from US manufacturing firms; it is a composite index with equal weights to sub-indexes, including new orders, production, employment, supplier delivers and inventories.
- Baltic Dry Shipping Index measures the cost to ship various dry raw materials used in manufacturing, such as coal, iron ore and grains, based on average prices paid for various shipping routes.